Whenever there is any application slowness or any other performance issue, regardless of source of the problems, the first question comes to DBA that Oracle is slow, is there anything wrong with database?
As a DBA we use to face this situation day to day. This doesn't mean there is no problem from database but many times it could be a server, storage or network bottleneck. May be issue with application coding.
In order to provide quick solution DBA will do some troubleshooting on database level and try to find out if there is any bottleneck in database but if dba can not identify issue or others would not identify it till the time finger will be on database.
Traditional DBA will diagnose problem in database but an expert DBA will try to find the issue on database as well on server level.
In such scenario DBA must be familiar with the operating system commands used to extract information from the server. Need to analyse CPU, Memory, Network and Storage performance.
To analyse this you need to know some basic server level utility which can give you brief details regarding server resources and help you to reach at the source of problem. If you are a DMA or planning to make a career in DMA than this is perfectly fits for your profile.
Following are some performance monitoring tool to analyse the server performance.
vmstat (Virtual Memory Statisctis)
Monitors processes, CPU, memory, or disk I/O bottlenecks. It is used to quickly identified server bottleneck. It displays real time information about process, memory, paging, disk I/O and CPU usage. If you server seems sluggish, then vmstat output will help you to determine which resource are being consumed.
watch
This utility use to run command periodically.
ps (Process)
Use the ps command to identify the process IDs of sessions consuming the most CPU on the server. This next ps command displays the top ten CPU-consuming statements and the associated process IDs. Use to find out the session based on the most consuming system resource.


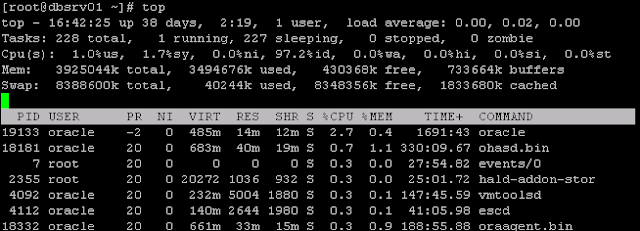
top
This utility is used to quickly identify which processes are the highest consumers of resources on the server. by default top is repetitively refresh utility. While top is running we can change output interactively.


mpstat (Multiple Processor Statistics)
mpstat utility is use to to determine CPU statistics. It gives broad view for CPU consumption for each CPU.


sar (System Activity Reporter)
This utility is useful to display current and historical processor load. You can also get the statistics for different day of a month.


free
df (Disk Free)
du (Disk Usage)
iostat (Input Output Statistics)
The iostat command can help you determine whether disk I/O is potentially a source of performance problems. This periodic extended output allows you to view in real time which devices are experiencing spikes in read and write activity.


netstat (Network Statistics)
Netstat is useful to display network traffic.

You can follow our Exadata Certification Question Bank to achieve maximum success in your Exadata certification exam.

You can follow our Exadata Certification Question Bank to achieve maximum success in your Exadata certification exam.


No comments:
Post a Comment